 |
| On top of the (modern) Suirakaku aqueduct bridge near the Nanzenji temple in Kyoto (Japan). The water - for Kyoto's water supply and electricity production - came from Lake Biwa. The bridge, built in 1889/1890, is 93 m long and 14 m high. ÅThere also a Lake Biwa Canal museum. Photo: M. van Kreveld 2011 |
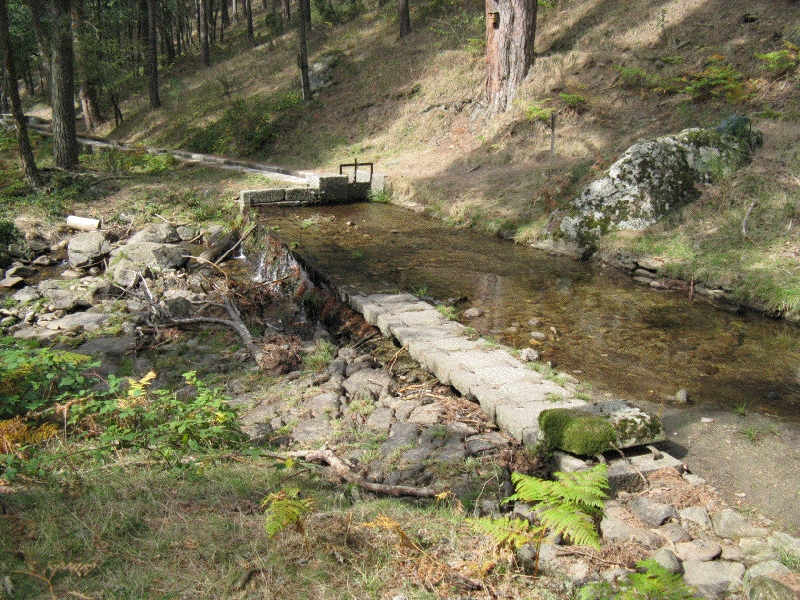 |
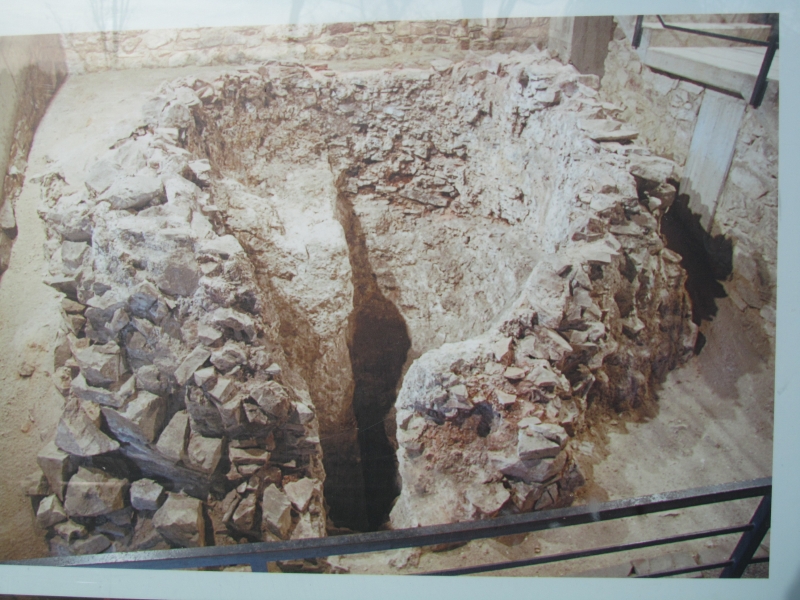
| The weir at the source of the Segovia aqueduct (Spain), seen from the south. The ledge of stone is the device built by the Roman engineers to lead the water into the aqueduct channel visible at the top. The block in the foreground, on top of the others was upturned during a flood and is not in its original position. |
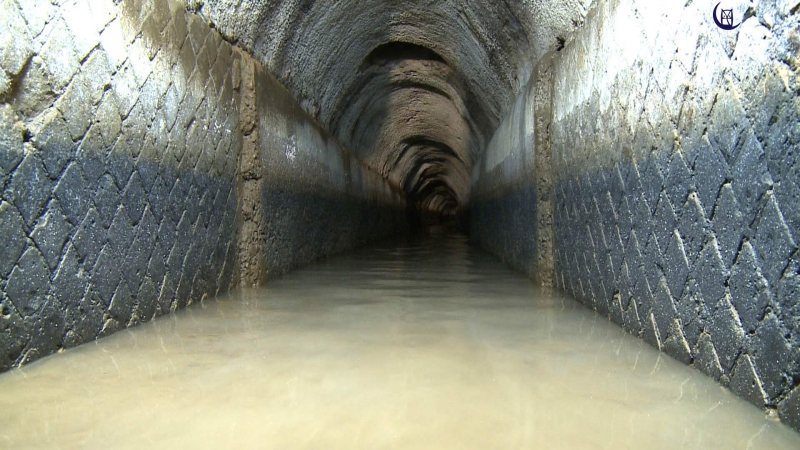 |
| Inside the Aqua Traiana, one of the 11 aqueducts of ancient Rome. Note the stone blocks forming the walls on both sides, laid in opus reticulatum. Photo from aqueducthunter.com |
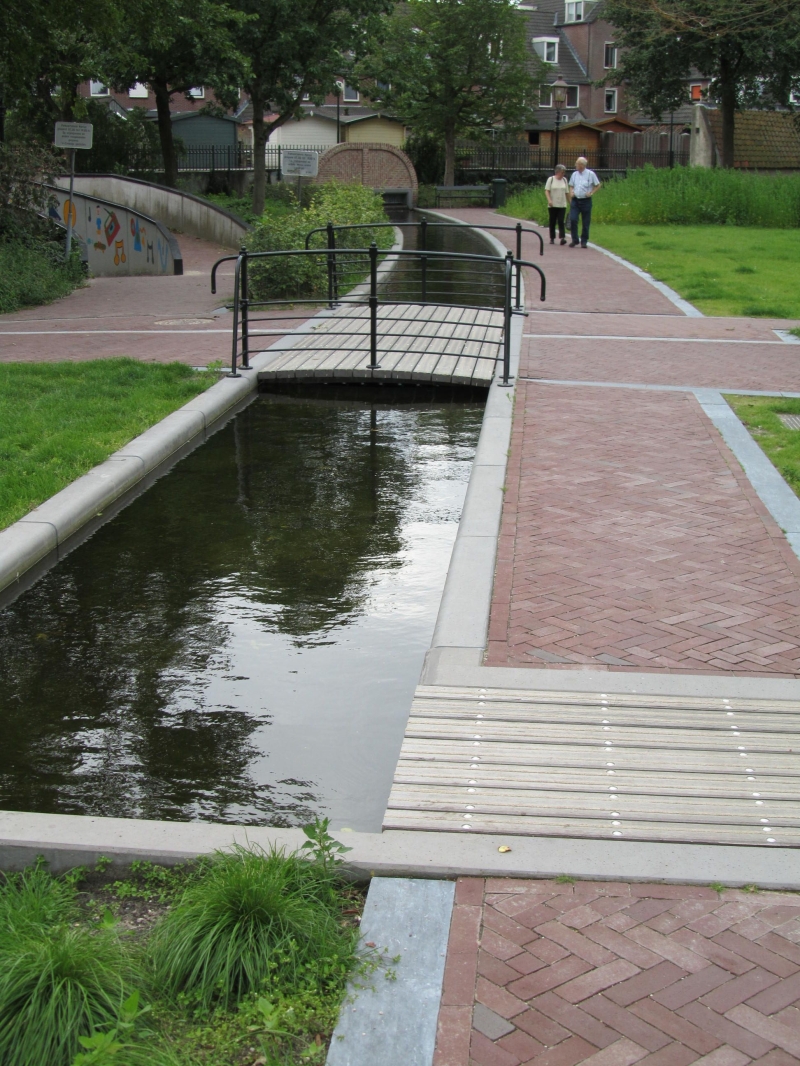 |
| Flowing water in a modern, uncovered aqueduct like setting in a park in Harderwijk (The Netherlands). |
Largest discharge of Roman aqueducts
The discharge of an aqueduct was never constant and depending amoung others of the type of the source, like a river take-off, infiltration gallery, or a spring. Some springs had a very erratic discharge like the copious karst spring of Fontaine de Vaucluse (France) with a present mean flow of 1,77 * 106 m3 per day and a maximum discharge of nearly 12 * 106 m3 per day. Another example: the Dumanli spring of the Manavgat river (Turkey) with a mean discharge 4,32 * 106 m3 per day (Hodge 1992 pag 407).So much water was not needed of course: the mean discharge of a Roman aqueduct of a typical medium size Roman town in the province was 10.000 - 20.000 m3 per day.
Sometimes multiple sources were used like the karst springs in Grand (France). An infiltration gallery would give a quite stable discharge; a river or an artificial lake offtake allows good control, see the one of Segovia (Spain).
The actual discharges of Roman aqueducts is often disputed. Calculations are difficult because of the many uncertain parameters like the different cross-sections along the course, the state of maintenance, the many leakages (see Frontinus), illegal offtakes etc. Some aqueducts were partly clogged by sinter / calcareous incrustation. Often the maximum capacity was calculated but most channels did not ran at maximum capacity, given the sinter deposits on the walls.
For the city of Rome often a discharge of all 11 aqueducts together was calculated up to over 1 million m3 per day, but one had to bear in mind that never all aqueducts were active at the same time.
Which means that it is nearly impossible to derive the number of inhabitants of a town from the daily water supply, given the daily use per capita, apart from the fact that much water was used for the bath buildings which number and size were more or less related to the period and the wealth of the city in question.
| Name aqueduct | Discharge (m3) | Literature | Remarks |
|---|---|---|---|
| Rome, Anio Novus | 190.000 | Hodge 1992, Aicher 1995, Chanson 2008 | |
| Rome, Aqua Marcia | 188.000 | Hodge 1992, Aicher 1995, Chanson 2008 | |
| Rome, Aqua Claudia | 185.000 | Hodge 1992, Aicher 1995 | |
| Rome, Anio Vetus | 180.000 | Aicher 1995 | |
| Rome, Aqua Traiana | 114.000 | Chanson 2008 | |
| Rome, Aqua Virgo | 100.000 | Aicher 1995, Chanson 2008 | |
| Corinth (Greece) | 80.000 | Chanson 2008 | |
| Frejus (France) | 52.000 | Gebara 2002 | |
| Cherchel (Algeria) | 40.000 | Chanson 2008 | |
| Nimes (France) | 29.600 | Chanson 2002d | mean discharge |
| Carthage (Tunisia) | 17.300 | Chanson 2008 | |
| Lyon, Gier (France) | 15.000 | Chanson 2008 | |
| Metz (France) | 8.050 | Chanson 2002d | |
| Arles (France) | 8.000 | Chanson 2008 |
| HOME | Literature references | Last modified: January, 2012 by w.d.schram 'at' romanaqueducts.info |